 |
BCGControlBar Pro for MFC
|
|
BCGControlBar Pro for MFC
|
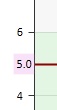
The CBCGPChartAxisMarkObject class represents a Chart Object that can be placed near a related axis and specify some concrete value (or text).
This picture demonstrates an axis mark placed at Y axis value 5 to highlight the current value of horizontal line (see Chart Objects view in BCGPChartExample).
The following code adds an axis mark to the diagram using an CBCGPChartVisualObject::AddChartAxisMarkObject helper implemented in CBCGPChartVisualObject:
Here we added a text "5.0" at value 5. of the vertical axis (TRUE) and display the mark outside the axis (TRUE).
The helper does not provide the ability to shift the axis mark object by a couple of pixels relative to axis position, but you can modify the coordinates of the base object to do so.
The following example shifts the axis mark by 10 pixels from the Y axis:
You can create a base Chart Object (CBCGPChartObject) as an axis mark. In this case the CoordinateMode enumerated value should be set to CBCGPChartObject::CM_AXIS_INSIDE_MARK or CBCGPChartObject::CM_AXIS_OUTSIDE_MARK. "Generic" coordinates passed as a rectangle to constructor or method CBCGPChartObject::SetCoordinates are interpreted as following:
The following code illustrates how to use the base object to define an axis mark at Y coordinate 5.:
The axis marks can be formatted using CBCGPChartObject::m_format as any other text label, e.g you can set fill color, outline color, text color, font and other attributes. See CBCGPChartObject::SetAxisMarkCoordinate helper, which shows another way to turn a Chart Object into "axis mark".
 Inheritance diagram for CBCGPChartAxisMarkObject:
Public Member Functions | ||
| CBCGPChartAxisMarkObject | The constructor. | |
| Public Member Functions inherited from CBCGPChartObject | ||
| CBCGPChartObject | Constructs a CBCGPChartObject object. | |
| GetBoundingRect | Returns a bounding rectangle of a Chart Object. | |
| GetCoordinateMode | Returns current coordinate mode. | |
| GetCoordinates | Returns current coordinates of a Chart Object. | |
| GetDescription | Obtain a chart object's description. | |
| GetObjectSize | Call this method to retrieve custom Chart Object size. | |
| GetTooltip | Obtain a chart object's tooltip. | |
| HitTest | Hit tests an Chart Object. | |
| IsForeground | Specifies whether a Chart Object is foreground, or background. | |
| IsObjectShownOnAxis | Tells whether an object is displayed on specified axis. | |
| IsVisible | Tells whether a Chart Object is visible, or hidden. | |
| OnCalcScreenPoints | Called by the framework to calculate screen positions (in parent Chart client coordinates). | |
| OnDraw | Called by the framework when it needs to draw a Chart Object. | |
| SetAxisMarkCoordinate | Sets "axis mark" coordinate. | |
| SetCoordinateMode | Sets new coordinate mode. | |
| SetCoordinates | Sets new coordinates. | |
| SetCoordinates | Sets new coordinates. | |
| SetCoordinates | Sets new coordinates. | |
| SetForeground | Sets a Chart Object foreground or background. | |
| SetObjectSize | Sets custom object size. | |
| SetParentChart | Sets the parent Chart. | |
| SetRelatedAxes | Sets related axes. | |
| SetTooltip | Specifies a chart object's tooltip. | |
| SetVisible | Shows or hides a Chart Object. | |
Additional Inherited Members | ||
| Public Attributes inherited from CBCGPChartObject | ||
| m_format | Specifies a Chart Object formatting options. | |
| m_nObjectID | Specifies a Chart Object ID. | |
| m_strText | Specifies Chart Object's text. | |
| Protected Member Functions inherited from CBCGPChartObject | ||
| OnCalcObjectSize | Called by the framework to calculate a Chart Object size. | |
| OnDrawShape | Called to draw a Chart Object's shape. | |
| OnDrawText | Called to draw a Chart Object's text. | |