 |
BCGControlBar Pro for MFC
|
|
BCGControlBar Pro for MFC
|
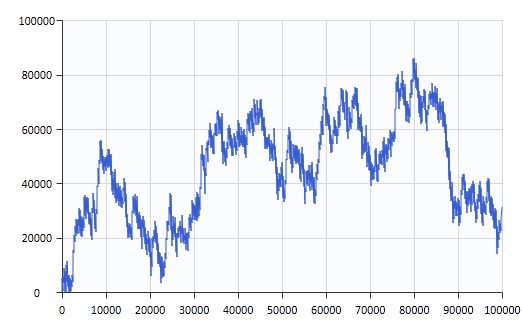
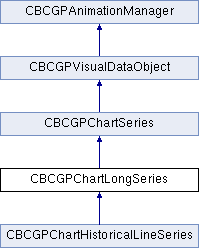
The CBCGPChartLongSeries class implements a line series, which is optimized to handle a large amount of data (hundreds thousands of data points).
Because of optimization the series has some limitations: it can't display data markers and data labels.
The long data series ignores X values, all data points are displayed according to their index.
If a lot of data is displayed on a single pixel, it produces some "noise" on the diagram and slows down redrawing. Call SetFilterSimilarXValues() to reduce the "noise". The series will perform additional optimization and display average Y values calculated among all values falling on the same pixel (it may be not suitable for some cases, because average hides the real picture).
 Inheritance diagram for CBCGPChartLongSeries:
Public Member Functions | ||
| CBCGPChartLongSeries | Constructs a long data series object. | |
| AddDataPoint | Adds a new data point to a long data series. | |
| AddDataPoint | Adds a new data point to a long data series. | |
| AddDataPoint | Adds a new data point to a long data series. | |
| AddDataPoint | Adds a new data point to a long data series. | |
| EnableAutoColorDataPoints | Overridden. Prevents coloring of individual data points for a long series. | |
| FindDataPointIndex | Should not be called for a long data series. | |
| GetDataPointAt | Returns a dummy data point with X and Y components set. | |
| GetDataPointCount | Return number of values in a long series. | |
| GetDataPointValue | Returns a value located at the specified index. | |
| IsAutoColorDataPoints | Overridden. Always returns FALSE. | |
| IsFilterSimilarXValues | Tells whether the series works in "optimized" mode. | |
| IsOrderedXValues | Tells whether data points are not ordered by X axis. | |
| MoveDataPoints | Moves data points inside a series. | |
| RemoveAllDataPoints | Removes all data points from a series. | |
| RemoveDataPoints | Removes data points from a series. | |
| SetDataPointCount | Preallocates the internal array of values. | |
| SetDataPointValue | Modifies a value at specified data point index. | |
| SetFilterSimilarXValues | Optimizes performance by displaying average calculated among all Y values falling on the same pixel. | |
| SetOrderedXValues | Specifies whether data points are ordered by X axis. By default, the data points are ordered. | |
| SetSeriesData | Sets data at the specified index. | |
| Public Member Functions inherited from CBCGPChartSeries | ||
| AddDataPoint | Adds a new data point to a series. | |
| AddDataPoint | Adds a new data point to a series. | |
| CanBeConvertedToCategory | Tells whether a series can be converted to the specified category. | |
| CanIncludeDataPointToLegend | Tells whether a data point can be displayed in a legend. | |
| ClearMinMaxValues | Clears minimum and maximum series values. | |
| CopyDataPoints | Copies all data points to a destination array. | |
| CopyFrom | Sets a series from a source series. | |
| CreateErrorBars | Adds error bars to the series. | |
| EnableHistoryMode | Enables "history" mode for any series. | |
| EnableUpdateAxesOnNewData | Enables or disables update of X axis when a new data point has been added. | |
| GetAxesBoundingRect | Returns a rectangle formed by axes a series is shown on. | |
| GetChartCategory | Returns series category. | |
| GetChartCtrl | Returns a pointer to related chart visual objects. | |
| GetChartImpl | Returns a pointer to a current chart implementation. | |
| GetChartType | Returns current series type (simple, stacked, full stacked, range). | |
| GetColorIndex | Returns series color index. | |
| GetColors | Returns a set of colors used to display series elements, markers and labels. | |
| GetCurveType | Returns a curve type used to draw series lines. | |
| GetDataBuffer | Gets a pointer to array of double values, which can be used to store additional series values. | |
| GetDataPointCategoryName | Returns category name of a data point. | |
| GetDataPointColorIndex | Returns a color index for the specified data point. | |
| GetDataPointFormat | Returns data point formatting options. | |
| GetDataPointLabelText | Returns a data point's label text. | |
| GetDataPointScreenPoint | Returns a screen point associated with a data point. | |
| GetDataPointScreenPointCount | Returns the number of screen points associated with a data point. | |
| GetDataPointShape3D | Returns a pointer to 3D shape object representing a data point on 3D diagram. | |
| GetFormula | Returns a formula used to generate series data points. | |
| GetGroupID | Returns series group ID. | |
| GetHistoryDepth | Returns history depth for a series in "history" mode. | |
| GetLongDataOffset | Gets offset of long data. | |
| GetLongDataX | Gives access to array of X values used for optimized mode. | |
| GetLongDataY | Gives access to array of Y values used for optimized mode. | |
| GetLongDataY1 | Gives access to array of Y1 values used for optimized mode. | |
| GetMaxValue | Returns maximum series value for the specified component. | |
| GetMinValue | Returns minimum series value for the specified component. | |
| GetSeriesFormat | Returns series format. | |
| HasErrorBars | Tells whether a chart series has error bars. | |
| IsBackgroundOrder | Tells whether a series has background order. | |
| IsHistoryMode | Tells whether a series works in history mode. | |
| IsOptimizedLongDataMode | Tells whether a series works in "optimized long data" mode. | |
| IsUpdateAxesOnNewDataEnabled | Tells whether related axes are updated when a new data point is added. | |
| IsVirtualMode | Tells whether a series works in virtual mode. | |
| RecalcMinMaxValues | Recalculates minimum and maximum series values. | |
| RecreateErrorBars | Recreate existing error bars. | |
| RemoveErrorBars | Removes all previously created error bars. | |
| SetChartImpl | Sets a chart implementation. | |
| SetChartType | Sets new series category and type. | |
| SetCurveType | Sets curve type. | |
| SetDataLabelAngle | Sets angle of data point's data label. | |
| SetDataLabelContent | Sets data label content. | |
| SetDataLabelContentPadding | Sets data label content padding. | |
| SetDataLabelDataFormat | Sets data label data format. | |
| SetDataLabelDisplayKey | Tells the data label display legend key. | |
| SetDataLabelDistanceFromMarker | Sets distance between data label and data marker. | |
| SetDataLabelDrawBorder | Sets "draw border" option for the data labels. | |
| SetDataLabelDropLineToMarker | Sets option to connect data label and data marker by line (draw callout). | |
| SetDataLabelFill | Sets data label background color. | |
| SetDataLabelFormat | Sets data label format. | |
| SetDataLabelLineColor | Sets data label line color (color of border and callout line). | |
| SetDataLabelLineWidth | Sets data label line width (width of border and callout). | |
| SetDataLabelOptions | Sets data label formatting options. | |
| SetDataLabelPosition | Sets data label position. | |
| SetDataLabelSeparator | Sets a separator string (a string that separates data label values). | |
| SetDataLabelStrokeStyle | Sets data label stroke style (style of border and callout). | |
| SetDataLabelTextFormat | Sets data label text format. | |
| SetDataLabelUnderline | Sets data label underline option. Not compatible with "draw border". | |
| SetDataPoint3DLineThickness | Sets thickness of lines on 3D line chart. | |
| SetDataPointCategoryName | Sets data point category name. | |
| SetDataPointColorIndex | Sets data point color index. | |
| SetDataPointLabelRect | Called to store bounding rectangle of data label. | |
| SetDataPointScreenPoint | Called to store screen position of data point. | |
| SetDefaultFillGradientType | Sets default fill gradient type. | |
| SetFormula | Call this method to set a formula generating data points for the series. | |
| SetGroupID | Sets series group ID. | |
| SetIgnoreNegativeValues | Sets an option to ignore negative values. | |
| SetLegendLabelContent | Specifies the content to be displayed in the legend. | |
| SetLegendLabelFillColor | Sets legend label fill color. | |
| SetLegendLabelFormat | Sets legend label data format. | |
| SetLegendLabelTextColor | Sets text color of a legend label. | |
| SetLegendLabelTextFormat | Sets text format of a legend label. | |
| SetLongDataOffset | Sets long data offset. | |
| SetMarkerFill | Sets marker fill brush for all data points, or for specified data point. | |
| SetMarkerFormat | Sets marker format for all data points, or for individual data point. | |
| SetMarkerLineColor | Sets marker line color for all data points, or for individual data point. | |
| SetMarkerLineWidth | Sets marker line width for all data points, or for specified data point. | |
| SetMarkerOptions | Sets marker options for all markers, or for specified data point. | |
| SetMarkerShape | Sets marker shape either for all data points in a series, or for specified data point. | |
| SetMarkerSize | Sets marker size either for all markers in a series, or for specified data point. | |
| SetMarkerStrokeStyle | Sets stroke style either for all series marker lines, or for specified data point. | |
| SetMaxValue | Sets maximum component value. | |
| SetMinMaxValues | Sets a new minimum or maximum value. | |
| SetMinValue | Sets minimum component value. | |
| SetRelatedAxes | Display a series on the specified axes. | |
| SetRelatedAxis | Display a series on the specified axis. | |
| SetSeriesElementFormat | Sets formatting options for a data point. | |
| SetSeriesFill | Sets fill brush for all series elements, or for specified data point. | |
| SetSeriesFormat | Sets series format. | |
| SetSeriesLineColor | Sets color either for all series lines, or for specified data point. | |
| SetSeriesLineDashStyle | Sets dash style either for all series lines, or for specified data point. | |
| SetSeriesLineWidth | Sets line width either for all series lines, or for specified data point. | |
| SetSeriesStrokeStyle | Sets stroke style either for all series lines, or for specified data point. | |
| SetTreatNulls | Defines series behavior when it encounters empty data. | |
| SetUseWordWrapForDataLabels | Sets an option to use word wrapping for long data labels. | |
| SetVirtualMode | Enables virtual mode for a series. | |
| ShowDataLabel | Shows or hides a data label for a data point, or for all data points in a series. | |
| ShowMarker | Shows or hides a data marker for a specific data point, or for a whole series. | |
| ShowOnPrimaryAxis | Shows a series on primary or secondary axes. | |
| UpdateAxes | Used in conjunction with "EnableHistoryMode" and updates axes when a new data point has been added. | |
| Public Member Functions inherited from CBCGPVisualDataObject | ||
| CBCGPVisualDataObject | Default constructor. | |
| CBCGPVisualDataObject | Copy constructor. | |
| CreateCopy | Creates the copy. | |
| GetParentVisual | Gets the parent visual object. | |
| GetValue | Gets the value. | |
| SetValue | Sets a value. | |
| Public Member Functions inherited from CBCGPAnimationManager | ||
| CBCGPAnimationManager | Default constructor. | |
| GetAnimatedValue | Gets current animated value. | |
| GetAnimationDuration | Gets animation duration. | |
| GetLastAnimationError | Gets the animation error returned by recent call to Windows Animation API. | |
| IsAnimated | Checks if animation is running. | |
| StartAnimation | Starts an animation. | |
| StartFlashAnimation | Starts "flash" animation. | |
| StopAnimation | Stops an animation. | |
Additional Inherited Members | ||
| Public Types inherited from CBCGPAnimationManager | ||
| enum | BCGPAnimationType | |
| Static Public Member Functions inherited from CBCGPAnimationManager | ||
| IsAnimationSupportedByOS | Checks if animation is supported by OS. | |
| Public Attributes inherited from CBCGPChartSeries | ||
| m_bIncludeDataPointLabelsToLegend | Specifies whether data point labels should be included in the legend. | |
| m_bIncludeSeriesToLegend | Specifies whether include a series key and name to the legend. | |
| m_bVisible | Shows or hides a series. | |
| m_nLegendKeyToLabelDistance | Specifies distance between legend key and data label text. | |
| m_strDefaultTooltipName | Specifies series name for tooltip. | |
| m_strSeriesName | Specifies series name. | |
| Protected Member Functions inherited from CBCGPChartSeries | ||
| DoMouseRotate | Called by the framework when user rotates the chart using mouse/gesture. | |
| Protected Member Functions inherited from CBCGPAnimationManager | ||
| OnAnimationIdle | Called by the framework in an animation idle time. | |