The CBCGPChartAxis implements the basic functionality of a chart axis.
Currently this functionality includes the following features:
- Name
- An axis can display or hide its name
- You can customize the appearance of Axis Name by setting its fill, outline and text colors, as well as the text font and direction
- Grid Lines
- Major Grid Lines for an axis can be shown or hidden
- Minor Grid Lines for an axis can be shown or hidden
- The colors of Major and Minor Grid Lines can be customized
- Major Grid Line Interlacing:
- The space between Major Grid Lines can be filled by a distinct color (by the default it's taken from current Color Theme)
- You can specify the first interval to fill
- You can specify the fill step (how many intervals are skipped)
- Axis Line and Tick Marks
- Customizable Major and Minor Tick Mark size
- Major and Minor Tick Marks can be hidden or have one of the following types:
- Cross the Axis
- Display outside the Axis
- Display inside the Axis
- The outline color, size and stroke style of each Axis Line and Tick Marks can be customized
- Axis Labels
- An Axis supports the following label display modes:
- No labels
- Labels next to axis
- Labels low (outside plot area, near the minimum display value)
- Labels high (outside plot area, near the maximum display value)
- Textual labels
- Custom format for Axis Labels
- Custom outline, fill and text colors for axis labels as well as custom font size and direction.
- You can completely customize label drawing by overriding several virtual methods
- Date/Time Mode
- The X axis can be set to the "date" mode. In this mode it treats the X component from related series as date/time values, calculates the Major Unit and formats the labels accordingly.
- Display Data between Tick Marks
- This mode can be turned on if the series X component is missing and/or automatically treated as a category index. In this case X coordinates of data points are "shifted" right on half major unit size. This mode is a default for Column and Bar series.
- Automatic and Manual Scaling
- It's possible to specify a fixed Major Unit for an axis
- You can specify a custom number of Minor Units
- Axes support a fixed grid size. In this mode you specify the distance between major grid lines in pixels and how many Data Points should be displayed within this interval. It's usable when you create real time charts and/or enable History Mode for series.
- Fixed Display Range
- You can specify a fixed display range for an axis and it will automatically calculate the required scale.
- You can specify a fixed Maximum Display Value separately.
- You can specify a fixed Minimum Display Value separately.
- Cross Type
- It's possible to specify where an Axis crosses its perpendicular axis.
- There are four supported cross types:
- Automatic (an axis automatically calculates the most suitable cross value based on perpendicular axis range)
- Maximum Displayed Value
- At Value (you can specify the cross value based on application-specific preferences)
- Ignore (axis is displayed at its default position always)
- Reverse Order
- Any Axis can display values in reverse order
- Axis Rotation
- Any series type can be displayed correctly when X axis is vertical and Y axis is horizontal.
- Secondary Axes
- The Chart control creates by default four axes - two primary and two secondary. The default positions for secondary axes are right (Y) and top (X) respectively. You can force to display the secondary axes even if they do not display any series.
- Any series can be displayed on primary or secondary axes and this option can be chosen at the runtime
- Multiple Custom Axes
- It's possible to create and add to a particular chart as many custom axes as you wish.
- Each axis (including the standard primary and secondary) can be positioned within the plot area using the top and bottom (which will be right or left for horizontal axes) offsets specified in percents.
- Any series can be assigned a pair of custom axes and thus be displayed in the specified area of the main plot area.
- Multiple vertical axes may have one horizontal related axis (and vice versa). In this way different series having similar X component (for example, date/time) can be displayed on the same plot area separately.
- Zoom and Scroll
- Axis scale breaks.
|
| | AddScaleBreak | Adds a new scale break. |
| |
| | CalcMajorMinorUnits | Calculates major and minor units for an axis. |
| |
| | CalcMinMaxDisplayedValues | Called to calculate minimum and maximum displayed values. |
| |
| | CalcMinMaxValues | Called to calculate minimum and maximum values among all series displayed on axis. |
| |
| | CanBeScrolled | Tells whether an axis can be scrolled. |
| |
| | CanDisplayDataBetweenTickMarks | Tells whether an axis can display data points positioned between tick marks. |
| |
| | CanShowScrollBar | Specifies whether an axis can display a scroll bar. |
| |
| | CanUseScaleBreaks | Tells whether an axis can display scale breaks. |
| |
| | EnableAllUnitsOnFixedInterval | Specifies whether partially visible data points for a fixed interval width should be drawn. |
| |
| | EnableIndependentZoom | Enables or disables independent zoom. |
| |
| | EnableMajorUnitIntervalInterlacing | Enables major unit interlacing. |
| |
| | EnableScaleBreaks | Enables or disables axis scale breaks. |
| |
| | EnableScroll | Enables or disables axis scrolling. |
| |
| | EnableZoom | Enables or disables axis zooming. |
| |
| | GenerateScaleBreaks | Generates scale breaks. |
| |
| | GetAxisGap | Gets the distance between two axes that share the same perpendicular axis. |
| |
| | GetAxisPos | Gets axis start and end points in client coordinates. |
| |
| | GetAxisRect | Gets an axis rectangle. |
| |
| | GetAxisSize | Calculates axis size in pixels. |
| |
| | GetBottomOffset | Gets axis offset from the bottom or left side of the diagram area. |
| |
| | GetBoundingRect | Returns bounding rectangle of this axis and its perpendicular axis. |
| |
| | GetBoundingRects | Returns a list of bounding rectangles formed by this axis and its perpendicular axes. |
| |
| | GetComponentIndex | Returns component index of chart data this axis uses to display values. |
| |
| | GetCrossValuePos | Returns current cross value. |
| |
| | GetCustomPerpendicularAxis | Returns a pointer to custom perpendicular axis. |
| |
| | GetDisplayedLabel | Maps the specified value to a text label. |
| |
| | GetDisplayUnits | Returns displayed units. |
| |
| | GetFirstInterlacedIntervalIndex | Returns first interlaced interval index. |
| |
| | GetFixedIntervalWidth | Returns fixed interval width. |
| |
| | GetFixedIntervalWidthScaled | Returns fixed interval width in device units taking into account DPI settings. |
| |
| | GetIndexedSeries | Returns indexed series. |
| |
| | GetInterlaceStep | Returns interlace step. |
| |
| | GetLabelDistance | Returns distance between axis labels and the axis line. |
| |
| | GetLogScaleBase | Returns current logarithmic scale base. |
| |
| | GetMajorTickMarkLen | Returns size, in pixels, of major tick marks. |
| |
| | GetMajorUnit | Returns major axis unit. |
| |
| | GetMaxDisplayedValue | Returns maximum displayed value. |
| |
| | GetMaxScrollValue | Returns maximum scroll value. |
| |
| | GetMaxZoomInFactor | Returns maximal zoom factor. |
| |
| | GetMinDisplayedValue | Returns minimum displayed value. |
| |
| | GetMinorUnitCount | Returns minor unit count. |
| |
| | GetMinScrollValue | Returns minimum scroll value. |
| |
| | GetOppositeAxis | Returns a pointer to an opposite axis. |
| |
| | GetPerpendecularAxis | Returns a perpendicular axis. |
| |
| | GetRightOffsetAsNumberOfValues | Converts offset in pixels to offset in values, taking into account the current zoom level. |
| |
| | GetRightOffsetInPixels | Returns offset from the right bound of plot area in pixels. |
| |
| | GetScaleBreakCount | Returns a number of scale breaks. |
| |
| | GetScaleBreaksOptions | Returns scale break options. |
| |
| | GetScrollBarRect | Returns bounding rectangle of scroll bar. |
| |
| | GetSplitBottom | Returns a pointer to a next split axis located at the bottom of this axis. |
| |
| | GetSplitTop | Returns a pointer to a next split axis located at the top of this axis. |
| |
| | GetTopOffset | Returns a top offset for an axis. |
| |
| | GetValuesPerInterval | Returns a number of values per interval. |
| |
| | HasSeries | Tells whether there is at least one series, which is displayed on an axis. |
| |
| | HitTest | Retrieves hit test info for an axis. |
| |
| | IsAllUnitsOnFixedInterval | Tells whether partially visible data points for a fixed interval width should be drawn. |
| |
| | IsAlwaysShowScrollBar | Tells whether a scroll bar has an "always visible" flag set. |
| |
| | IsAxisVisible | Tells whether an axis is visible, or not. |
| |
| | IsComponentXSet | Tells whether X component has been set for at least one series that is displayed on an axis. |
| |
| | IsDisplayDataBetweenTickMarks | Tells whether an axis displays data between tick marks. |
| |
| | IsFixedDisplayRange | Tells whether an axis displays some predefined fixed range. |
| |
| | IsFixedIntervalWidth | Tells whether an axis works in "fixed interval width" mode. |
| |
| | IsFixedMajorUnit | Tells whether a fixed major unit is specified. |
| |
| | IsFixedMaximumDisplayValue | Tells whether a fixed maximum displayed value has been specified. |
| |
| | IsFixedMinimumDisplayValue | Tells whether a fixed minimum displayed value has been specified. |
| |
| | IsIndependentZoomEnabled | Tells whether the independent zoom option is turned on or off. |
| |
| | IsIndexedSeries | Tells whether an axis works in "indexed" mode. |
| |
| | IsLogScale | Tells whether an axis has logarithmic scale. |
| |
| | IsMajorGridLinesVisible | Tells whether an axis displays major grid lines, or not. |
| |
| | IsMajorUnitIntervalInterlacingEnabled | Tells whether major unit interlacing is enabled. |
| |
| | IsMinorGridLinesVisible | Tells whether an axis displays minor grid lines, or not. |
| |
| | IsScaleBreakEnabled | Tells whether scale breaks feature is enabled or not. |
| |
| | IsScrollEnabled | Tells whether an axis can be scrolled. |
| |
| | IsVertical | Tells whether an axis is vertical or horizontal. |
| |
| | IsZoomed | Tells whether an axis is zoomed. |
| |
| | IsZoomEnabled | Tells whether zoom is enabled for an axis. |
| |
| | OnDraw | Called to draw an axis. |
| |
| | OnDrawAxisLabels | Called to draw axis labels. |
| |
| | OnDrawAxisName3D | Called to draw axis name for 3D chart. |
| |
| | OnDrawMajorGridLines | Called to draw major grid lines. |
| |
| | OnDrawMinorGridLines | Called to draw minor grid lines. |
| |
| | OnDrawScaleBreaks | Called to draw a scale break. |
| |
| | OnDrawScrollBar | Called to draw a scroll bar. |
| |
| | OnFillUnitIntervals | Called to fill major unit intervals with alternative color. |
| |
| | PointFromValue | Given a value in axis units calculates a point in client coordinates. |
| |
| | RemoveAllBreaks | Removes all scale breaks that have been added manually. |
| |
| | RemoveCustomAxis | Called for a custom axis when it's about to be removed from the chart. |
| |
| | Reset | Resets axis state to default. |
| |
| | Scroll | Scrolls an axis. |
| |
| | ScrollTo | Scrolls an axis to the specified value. |
| |
| | SetAlwaysShowScrollBar | Enables an axis to always show a scroll bar. |
| |
| | SetAutoDisplayRange | Sets automating display range (scaling). |
| |
| | SetAutoIntervalWidth | Sets automatic interval width mode. |
| |
| | SetAxisOffsets | Sets axis offsets. |
| |
| | SetCustomPerpendicularAxis | Specifies a perpendicular axis for an axis. |
| |
| | SetDisplayDataBetweenTickMarks | Causes data points to be displayed between tick marks. |
| |
| | SetDisplayUnits | Sets display units. |
| |
| | SetFirstInterlacedIntervalIndex | Sets index of first interlaced interval. |
| |
| | SetFixedDisplayRange | Sets fixed display range. |
| |
| | SetFixedIntervalWidth | Sets "fixed interval" mode. |
| |
| | SetFixedMajorUnit | Sets fixed major unit. |
| |
| | SetFixedMaximumDisplayValue | Sets fixed maximum displayed value. |
| |
| | SetFixedMinimumDisplayValue | Sets fixed minimum displayed value. |
| |
| | SetFixedUnitCount | Sets a value that fixes the number of displayed major units. |
| |
| | SetIndexedSeries | Sets indexed series. |
| |
| | SetInterlaceStep | Sets interlace step value. |
| |
| | SetLogScale | Enables or disables logarithmic scale for the axis. |
| |
| | SetMajorTickMarkLen | Sets length, in pixels, of major tick marks. |
| |
| | SetMaximumValue | Sets the maximum value on an axis. |
| |
| | SetMaxZoomInFactor | Sets maximal zoom factor. |
| |
| | SetMinAllowedMajorUnit | Sets minimal allowed major unit value. |
| |
| | SetMinimumValue | Sets the minimum value on an axis. |
| |
| | SetMinorTickMarkLen | Sets length, in pixels, of minor tick marks. |
| |
| | SetMinorUnitCount | Sets the minor unit count. |
| |
| | SetMinThumbSize | Sets minimum thumb size. |
| |
| | SetRightOffsetInPixels | Sets offset of last displayed value in pixels for charts in "fixed interval" mode. |
| |
| | SetScrollBarSize | Sets scroll bar size. |
| |
| | SetScrollRange | Defines a scroll range for an axis. |
| |
| | SetVertical | Sets axis orientation. |
| |
| | ShowMajorGridLines | Shows or hides major grid lines. |
| |
| | ShowMinorGridLines | Shows or hides minor grid lines. |
| |
| | ShowScrollBar | Enables an axis to display a scroll bar. |
| |
| | Split | Splits an axis creating an additional custom axis. |
| |
| | UnZoom | Sets zoom 100% on an axis. |
| |
| | ValueFromPoint | Given a point in client coordinates calculates corresponding axis value. |
| |
| | Zoom | Zooms an axis. |
| |

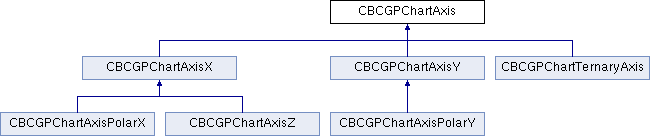
 Inheritance diagram for CBCGPChartAxis: