 |
BCGSuite for MFC
|
|
BCGSuite for MFC
|
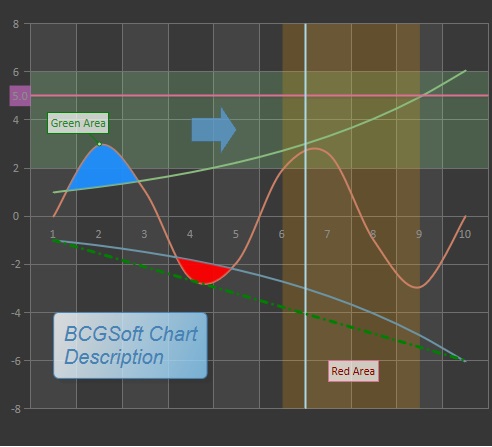
The CBCGPChartObject class implements Chart Objects. A Chart Object is defined as an (currently rectangular) area on the Chart (CBCGPChartVisualObject). The area can be formatted as any other chart element with text (see BCGPChartFormatLabel).
Placement of a Chart Object on the Chart is defined by one or more coordinates (stored as a rectangle) and a coordinate mode. Currently you can use the following coordinate modes defined by CBCGPChartObject::CoordinateMode enumerator (the documentation uses left, top, right, bottom members of CBCGPRect object to describe Chart Object's coordinates):
See CBCGPChartAxisMarkObject for more information about CM_AXIS_INSIDE_MARK and CM_AXIS_OUTSIDE_MARK coordinate modes.
You can skip coordinates of left-top or right-bottom corners for text objects or objects with custom size (you intend to call SetObjectSize() method). You can skip left-right or top-bottom coordinates for horizontal or vertical lines, or colored ranges. In this case the missing coordinates are calculated automatically.
You can specify the missing coordinates using the following static members:
The CBCGPChartVisualObject class provides the following helpers for the most commonly used object types:
The following code illustrates how to add a text object to the Chart. The text will be located at point (30, 120) in client coordinates (pixels).
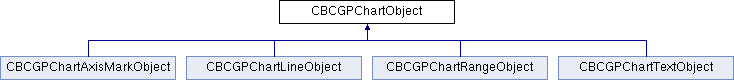
 Inheritance diagram for CBCGPChartObject:
Public Member Functions | ||
| CBCGPChartObject | Constructs a CBCGPChartObject object. | |
| GetBoundingRect | Returns a bounding rectangle of a Chart Object. | |
| GetCoordinateMode | Returns current coordinate mode. | |
| GetCoordinates | Returns current coordinates of a Chart Object. | |
| GetDescription | Obtain a chart object's description. | |
| GetObjectSize | Call this method to retrieve custom Chart Object size. | |
| GetTooltip | Obtain a chart object's tooltip. | |
| HitTest | Hit tests an Chart Object. | |
| IsForeground | Specifies whether a Chart Object is foreground, or background. | |
| IsObjectShownOnAxis | Tells whether an object is displayed on specified axis. | |
| IsVisible | Tells whether a Chart Object is visible, or hidden. | |
| OnCalcScreenPoints | Called by the framework to calculate screen positions (in parent Chart client coordinates). | |
| OnDraw | Called by the framework when it needs to draw a Chart Object. | |
| SetAxisMarkCoordinate | Sets "axis mark" coordinate. | |
| SetCoordinateMode | Sets new coordinate mode. | |
| SetCoordinates | Sets new coordinates. | |
| SetCoordinates | Sets new coordinates. | |
| SetCoordinates | Sets new coordinates. | |
| SetForeground | Sets a Chart Object foreground or background. | |
| SetObjectSize | Sets custom object size. | |
| SetParentChart | Sets the parent Chart. | |
| SetRelatedAxes | Sets related axes. | |
| SetTooltip | Specifies a chart object's tooltip. | |
| SetVisible | Shows or hides a Chart Object. | |
Public Attributes | ||
| m_format | Specifies a Chart Object formatting options. | |
| m_nObjectID | Specifies a Chart Object ID. | |
| m_strText | Specifies Chart Object's text. | |
Protected Member Functions | ||
| OnCalcObjectSize | Called by the framework to calculate a Chart Object size. | |
| OnDrawShape | Called to draw a Chart Object's shape. | |
| OnDrawText | Called to draw a Chart Object's text. | |