|
| | CBCGPChartPyramidSeries | Creates a CBCGPChartPyramidSeries object. |
| |
| | CBCGPChartPyramidSeries | Creates a CBCGPChartPyramidSeries object. |
| |
| | GetDepthPercent | Returns depth for 3D pyramid. |
| |
| | GetGap | Returns gap between pyramid segments. |
| |
| | GetRotation | Returns 3D pyramid rotation in degrees. |
| |
| | IsCircularBase | Tells whether 3D has circular base. |
| |
| | SetCircularBase | Sets circular base for 3D pyramid. |
| |
| | SetDepthPercent | Sets depth percent for 3D pyramid. |
| |
| | SetGap | Sets a gap between pyramid segments. |
| |
| | SetRotation | Sets rotation of 3D pyramid. |
| |
| | IsAlwaysShowTileCaption | Tells whether the tile caption (series name) should be displayed |
| |
| | SetAlwaysShowTileCaption | Specify whether the tile caption (series name) should be displayed. |
| |
| | AddDataPoint | Adds a new data point to a series. |
| |
| | AddDataPoint | Adds a new data point to a series. |
| |
| | AddDataPoint | Adds a new data point to a series. |
| |
| | AddDataPoint | Adds a new data point to a series. |
| |
| | AddDataPoint | Adds a new data point to a series. |
| |
| | AddDataPoint | Adds a new data point to a series. |
| |
| | AddDataPoints | Adds batch of data points. |
| |
| | AddEmptyDataPoint | Adds empty data point. |
| |
| | AddEmptyDataPoint | Adds empty data point. |
| |
| | AddEmptyDataPoint | Adds empty data point. |
| |
| | CanBeConvertedToCategory | Tells whether a series can be converted to the specified category. |
| |
| | ClearMinMaxValues | Clears minimum and maximum series values. |
| |
| | CopyDataPoints | Copies all data points to a destination array. |
| |
| | CopyFrom | Sets a series from a source series. |
| |
| | CreateErrorBars | Adds error bars to the series. |
| |
| | EnableHistoryMode | Enables "history" mode for any series. |
| |
| | EnableUpdateAxesOnNewData | Enables or disables update of X axis when a new data point has been added. |
| |
| | FindDataPointIndex | Finds index of data point. |
| |
| | GetChartCategory | Returns series category. |
| |
| | GetChartCtrl | Returns a pointer to related chart visual objects. |
| |
| | GetChartImpl | Returns a pointer to a current chart implementation. |
| |
| | GetChartType | Returns current series type (simple, stacked, full stacked, range). |
| |
| | GetColorIndex | Returns series color index. |
| |
| | GetColors | Returns a set of colors used to display series elements, markers and labels. |
| |
| | GetCurveType | Returns a curve type used to draw series lines. |
| |
| | GetDataBuffer | Gets a pointer to array of double values, which can be used to store additional series values. |
| |
| | GetDataPointAt | Returns a pointer to a data point located at the specified index. |
| |
| | GetDataPointColorIndex | Returns a color index for the specified data point. |
| |
| | GetDataPointCount | Returns a number of data points in a series. |
| |
| | GetDataPointFormat | Returns data point formatting options. |
| |
| | GetDataPointScreenPoint | Returns a screen point associated with a data point. |
| |
| | GetDataPointScreenPointCount | Returns the number of screen points associated with a data point. |
| |
| | GetDataPointShape3D | Returns a pointer to 3D shape object representing a data point on 3D diagram. |
| |
| | GetFormula | Returns a formula used to generate series data points. |
| |
| | GetGroupID | Returns series group ID. |
| |
| | GetHistoryDepth | Returns history depth for a series in "history" mode. |
| |
| | GetLongDataOffset | Gets offset of long data. |
| |
| | GetLongDataX | Gives access to array of X values used for optimized mode. |
| |
| | GetLongDataY | Gives access to array of Y values used for optimized mode. |
| |
| | GetLongDataY1 | Gives access to array of Y1 values used for optimized mode. |
| |
| | GetMaxValue | Returns maximum series value for the specified component. |
| |
| | GetMinValue | Returns minimum series value for the specified component. |
| |
| | GetSeriesFormat | Returns series format. |
| |
| | HasErrorBars | Tells whether a chart series has error bars. |
| |
| | IsBackgroundOrder | Tells whether a series has background order. |
| |
| | IsHistoryMode | Tells whether a series works in history mode. |
| |
| | IsOptimizedLongDataMode | Tells whether a series works in "optimized long data" mode. |
| |
| | IsUpdateAxesOnNewDataEnabled | Tells whether related axes are updated when a new data point is added. |
| |
| | IsVirtualMode | Tells whether a series works in virtual mode. |
| |
| | RecalcMinMaxValues | Recalculates minimum and maximum series values. |
| |
| | RecreateErrorBars | Recreate existing error bars. |
| |
| | RemoveDataPoints | Removes data points. |
| |
| | RemoveErrorBars | Removes all previously created error bars. |
| |
| | SetChartImpl | Sets a chart implementation. |
| |
| | SetChartType | Sets new series category and type. |
| |
| | SetCurveType | Sets curve type. |
| |
| | SetDataLabelAngle | Sets angle of data point's data label. |
| |
| | SetDataLabelContent | Sets data label content. |
| |
| | SetDataLabelContentPadding | Sets data label content padding. |
| |
| | SetDataLabelDataFormat | Sets data label data format. |
| |
| | SetDataLabelDisplayKey | Tells the data label display legend key. |
| |
| | SetDataLabelDistanceFromMarker | Sets distance between data label and data marker. |
| |
| | SetDataLabelDrawBorder | Sets "draw border" option for the data labels. |
| |
| | SetDataLabelDropLineToMarker | Sets option to connect data label and data marker by line (draw callout). |
| |
| | SetDataLabelFill | Sets data label background color. |
| |
| | SetDataLabelFormat | Sets data label format. |
| |
| | SetDataLabelLineColor | Sets data label line color (color of border and callout line). |
| |
| | SetDataLabelLineWidth | Sets data label line width (width of border and callout). |
| |
| | SetDataLabelOptions | Sets data label formatting options. |
| |
| | SetDataLabelPosition | Sets data label position. |
| |
| | SetDataLabelSeparator | Sets a separator string (a string that separates data label values). |
| |
| | SetDataLabelStrokeStyle | Sets data label stroke style (style of border and callout). |
| |
| | SetDataLabelTextFormat | Sets data label text format. |
| |
| | SetDataLabelUnderline | Sets data label underline option. Not compatible with "draw border". |
| |
| | SetDataPoint3DLineThickness | Sets thickness of lines on 3D line chart. |
| |
| | SetDataPointCategoryName | Sets data point category name. |
| |
| | SetDataPointColorIndex | Sets data point color index. |
| |
| | SetDataPointLabelRect | Called to store bounding rectangle of data label. |
| |
| | SetDataPointScreenPoint | Called to store screen position of data point. |
| |
| | SetDataPointValue | Sets a new value for the specified data point at specified component index. |
| |
| | SetDefaultFillGradientType | Sets default fill gradient type. |
| |
| | SetFormula | Call this method to set a formula generating data points for the series. |
| |
| | SetGroupID | Sets series group ID. |
| |
| | SetIgnoreNegativeValues | Sets an option to ignore negative values. |
| |
| | SetLegendLabelContent | Specifies the content to be displayed in the legend. |
| |
| | SetLegendLabelFillColor | Sets legend label fill color. |
| |
| | SetLegendLabelFormat | Sets legend label data format. |
| |
| | SetLegendLabelTextColor | Sets text color of a legend label. |
| |
| | SetLegendLabelTextFormat | Sets text format of a legend label. |
| |
| | SetLongDataOffset | Sets long data offset. |
| |
| | SetMarkerFill | Sets marker fill brush for all data points, or for specified data point. |
| |
| | SetMarkerFormat | Sets marker format for all data points, or for individual data point. |
| |
| | SetMarkerLineColor | Sets marker line color for all data points, or for individual data point. |
| |
| | SetMarkerLineWidth | Sets marker line width for all data points, or for specified data point. |
| |
| | SetMarkerOptions | Sets marker options for all markers, or for specified data point. |
| |
| | SetMarkerShape | Sets marker shape either for all data points in a series, or for specified data point. |
| |
| | SetMarkerSize | Sets marker size either for all markers in a series, or for specified data point. |
| |
| | SetMarkerStrokeStyle | Sets stroke style either for all series marker lines, or for specified data point. |
| |
| | SetMaxValue | Sets maximum component value. |
| |
| | SetMinMaxValues | Sets a new minimum or maximum value. |
| |
| | SetMinValue | Sets minimum component value. |
| |
| | SetRelatedAxes | Display a series on the specified axes. |
| |
| | SetRelatedAxis | Display a series on the specified axis. |
| |
| | SetSeriesElementFormat | Sets formatting options for a data point. |
| |
| | SetSeriesFill | Sets fill brush for all series elements, or for specified data point. |
| |
| | SetSeriesFormat | Sets series format. |
| |
| | SetSeriesLineColor | Sets color either for all series lines, or for specified data point. |
| |
| | SetSeriesLineDashStyle | Sets dash style either for all series lines, or for specified data point. |
| |
| | SetSeriesLineWidth | Sets line width either for all series lines, or for specified data point. |
| |
| | SetSeriesStrokeStyle | Sets stroke style either for all series lines, or for specified data point. |
| |
| | SetTreatNulls | Defines series behavior when it encounters empty data. |
| |
| | SetUseWordWrapForDataLabels | Sets an option to use word wrapping for long data labels. |
| |
| | SetVirtualMode | Enables virtual mode for a series. |
| |
| | ShowDataLabel | Shows or hides a data label for a data point, or for all data points in a series. |
| |
| | ShowMarker | Shows or hides a data marker for a specific data point, or for a whole series. |
| |
| | ShowOnPrimaryAxis | Shows a series on primary or secondary axes. |
| |
| | UpdateAxes | Used in conjunction with "EnableHistoryMode" and updates axes when a new data point has been added. |
| |
| | CBCGPVisualDataObject | Default constructor. |
| |
| | CBCGPVisualDataObject | Copy constructor. |
| |
| | CreateCopy | Creates the copy. |
| |
| | GetParentVisual | Gets the parent visual object. |
| |
| | GetValue | Gets the value. |
| |
| | SetValue | Sets a value. |
| |
| | CBCGPAnimationManager | Default constructor. |
| |
| | GetAnimatedValue | Gets current animated value. |
| |
| | GetAnimationDuration | Gets animation duration. |
| |
| | GetLastAnimationError | Gets the animation error returned by recent call to Windows Animation API. |
| |
| | IsAnimated | Checks if animation is running. |
| |
| | StartAnimation | Starts an animation. |
| |
| | StartFlashAnimation | Starts "flash" animation. |
| |
| | StopAnimation | Stops an animation. |
| |

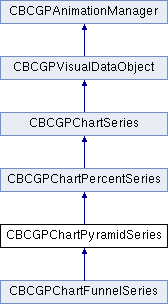
 Inheritance diagram for CBCGPChartPyramidSeries: