The CBCGPChartAxisX implements specific X axis features.
The library automatically creates two X axes with BCGP_CHART_X_PRIMARY_AXIS and BCGP_CHART_X_SECONDARY_AXIS IDs so you can obtain them using CBCGPChartVisualObject::GetChartAxis method.
|
| | CBCGPChartAxisX | Constructs X axis. |
| |
| | IsDisplayDataBetweenTickMarks | Tells whether data points on X axis are displayed on tick marks, or between tick marks. |
| |
| | Reset | Resets an axis to a default state. |
| |
| | AddScaleBreak | Adds a new scale break. |
| |
| | CalcMinMaxDisplayedValues | Called to calculate minimum and maximum displayed values. |
| |
| | CanBeScrolled | Tells whether an axis can be scrolled. |
| |
| | CanShowScrollBar | Specifies whether an axis can display a scroll bar. |
| |
| | CanUseScaleBreaks | Tells whether an axis can display scale breaks. |
| |
| | EnableAllUnitsOnFixedInterval | Specifies whether partially visible data points for a fixed interval width should be drawn. |
| |
| | EnableIndependentZoom | Enables or disables independent zoom. |
| |
| | EnableMajorUnitIntervalInterlacing | Enables major unit interlacing. |
| |
| | EnableScaleBreaks | Enables or disables axis scale breaks. |
| |
| | EnableScroll | Enables or disables axis scrolling. |
| |
| | EnableZoom | Enables or disables axis zooming. |
| |
| | GenerateScaleBreaks | Generates scale breaks. |
| |
| | GetAxisGap | Gets the distance between two axes that share the same perpendicular axis. |
| |
| | GetAxisPos | Gets axis start and end points in client coordinates. |
| |
| | GetAxisRect | Gets an axis rectangle. |
| |
| | GetAxisSize | Calculates axis size in pixels. |
| |
| | GetBottomOffset | Gets axis offset from the bottom or left side of the diagram area. |
| |
| | GetBoundingRect | Returns bounding rectangle of this axis and its perpendicular axis. |
| |
| | GetBoundingRects | Returns a list of bounding rectangles formed by this axis and its perpendicular axes. |
| |
| | GetCrossValuePos | Returns current cross value. |
| |
| | GetCustomPerpendicularAxis | Returns a pointer to custom perpendicular axis. |
| |
| | GetDisplayUnits | Returns displayed units. |
| |
| | GetFirstInterlacedIntervalIndex | Returns first interlaced interval index. |
| |
| | GetFixedIntervalWidth | Returns fixed interval width. |
| |
| | GetFixedIntervalWidthScaled | Returns fixed interval width in device units taking into account DPI settings. |
| |
| | GetIndexedSeries | Returns indexed series. |
| |
| | GetInterlaceStep | Returns interlace step. |
| |
| | GetLabelDistance | Returns distance between axis labels and the axis line. |
| |
| | GetLogScaleBase | Returns current logarithmic scale base. |
| |
| | GetMajorTickMarkLen | Returns size, in pixels, of major tick marks. |
| |
| | GetMajorUnit | Returns major axis unit. |
| |
| | GetMaxDisplayedValue | Returns maximum displayed value. |
| |
| | GetMaxScrollValue | Returns maximum scroll value. |
| |
| | GetMaxZoomInFactor | Returns maximal zoom factor. |
| |
| | GetMinDisplayedValue | Returns minimum displayed value. |
| |
| | GetMinorUnitCount | Returns minor unit count. |
| |
| | GetMinScrollValue | Returns minimum scroll value. |
| |
| | GetRightOffsetAsNumberOfValues | Converts offset in pixels to offset in values, taking into account the current zoom level. |
| |
| | GetRightOffsetInPixels | Returns offset from the right bound of plot area in pixels. |
| |
| | GetScaleBreakCount | Returns a number of scale breaks. |
| |
| | GetScaleBreaksOptions | Returns scale break options. |
| |
| | GetScrollBarRect | Returns bounding rectangle of scroll bar. |
| |
| | GetSplitBottom | Returns a pointer to a next split axis located at the bottom of this axis. |
| |
| | GetSplitTop | Returns a pointer to a next split axis located at the top of this axis. |
| |
| | GetTopOffset | Returns a top offset for an axis. |
| |
| | GetValuesPerInterval | Returns a number of values per interval. |
| |
| | HasSeries | Tells whether there is at least one series, which is displayed on an axis. |
| |
| | HitTest | Retrieves hit test info for an axis. |
| |
| | IsAllUnitsOnFixedInterval | Tells whether partially visible data points for a fixed interval width should be drawn. |
| |
| | IsAlwaysShowScrollBar | Tells whether a scroll bar has an "always visible" flag set. |
| |
| | IsAxisVisible | Tells whether an axis is visible, or not. |
| |
| | IsFixedDisplayRange | Tells whether an axis displays some predefined fixed range. |
| |
| | IsFixedIntervalWidth | Tells whether an axis works in "fixed interval width" mode. |
| |
| | IsFixedMajorUnit | Tells whether a fixed major unit is specified. |
| |
| | IsFixedMaximumDisplayValue | Tells whether a fixed maximum displayed value has been specified. |
| |
| | IsFixedMinimumDisplayValue | Tells whether a fixed minimum displayed value has been specified. |
| |
| | IsIndependentZoomEnabled | Tells whether the independent zoom option is turned on or off. |
| |
| | IsIndexedSeries | Tells whether an axis works in "indexed" mode. |
| |
| | IsMajorGridLinesVisible | Tells whether an axis displays major grid lines, or not. |
| |
| | IsMajorUnitIntervalInterlacingEnabled | Tells whether major unit interlacing is enabled. |
| |
| | IsMinorGridLinesVisible | Tells whether an axis displays minor grid lines, or not. |
| |
| | IsScaleBreakEnabled | Tells whether scale breaks feature is enabled or not. |
| |
| | IsScrollEnabled | Tells whether an axis can be scrolled. |
| |
| | IsVertical | Tells whether an axis is vertical or horizontal. |
| |
| | IsZoomed | Tells whether an axis is zoomed. |
| |
| | IsZoomEnabled | Tells whether zoom is enabled for an axis. |
| |
| | OnDraw | Called to draw an axis. |
| |
| | OnDrawAxisLabels | Called to draw axis labels. |
| |
| | OnDrawAxisName3D | Called to draw axis name for 3D chart. |
| |
| | OnDrawMajorGridLines | Called to draw major grid lines. |
| |
| | OnDrawMinorGridLines | Called to draw minor grid lines. |
| |
| | OnDrawScaleBreaks | Called to draw a scale break. |
| |
| | OnDrawScrollBar | Called to draw a scroll bar. |
| |
| | OnFillUnitIntervals | Called to fill major unit intervals with alternative color. |
| |
| | PointFromValue | Given a value in axis units calculates a point in client coordinates. |
| |
| | RemoveAllBreaks | Removes all scale breaks that have been added manually. |
| |
| | RemoveCustomAxis | Called for a custom axis when it's about to be removed from the chart. |
| |
| | ScrollTo | Scrolls an axis to the specified value. |
| |
| | SetAlwaysShowScrollBar | Enables an axis to always show a scroll bar. |
| |
| | SetAutoDisplayRange | Sets automating display range (scaling). |
| |
| | SetAutoIntervalWidth | Sets automatic interval width mode. |
| |
| | SetAxisOffsets | Sets axis offsets. |
| |
| | SetCustomPerpendicularAxis | Specifies a perpendicular axis for an axis. |
| |
| | SetDisplayDataBetweenTickMarks | Causes data points to be displayed between tick marks. |
| |
| | SetDisplayUnits | Sets display units. |
| |
| | SetFirstInterlacedIntervalIndex | Sets index of first interlaced interval. |
| |
| | SetFixedDisplayRange | Sets fixed display range. |
| |
| | SetFixedIntervalWidth | Sets "fixed interval" mode. |
| |
| | SetFixedMajorUnit | Sets fixed major unit. |
| |
| | SetFixedMaximumDisplayValue | Sets fixed maximum displayed value. |
| |
| | SetFixedMinimumDisplayValue | Sets fixed minimum displayed value. |
| |
| | SetFixedUnitCount | Sets a value that fixes the number of displayed major units. |
| |
| | SetIndexedSeries | Sets indexed series. |
| |
| | SetInterlaceStep | Sets interlace step value. |
| |
| | SetLogScale | Enables or disables logarithmic scale for the axis. |
| |
| | SetMajorTickMarkLen | Sets length, in pixels, of major tick marks. |
| |
| | SetMaximumValue | Sets the maximum value on an axis. |
| |
| | SetMaxZoomInFactor | Sets maximal zoom factor. |
| |
| | SetMinAllowedMajorUnit | Sets minimal allowed major unit value. |
| |
| | SetMinimumValue | Sets the minimum value on an axis. |
| |
| | SetMinorTickMarkLen | Sets length, in pixels, of minor tick marks. |
| |
| | SetMinorUnitCount | Sets the minor unit count. |
| |
| | SetMinThumbSize | Sets minimum thumb size. |
| |
| | SetRightOffsetInPixels | Sets offset of last displayed value in pixels for charts in "fixed interval" mode. |
| |
| | SetScrollBarSize | Sets scroll bar size. |
| |
| | SetScrollRange | Defines a scroll range for an axis. |
| |
| | SetVertical | Sets axis orientation. |
| |
| | ShowMajorGridLines | Shows or hides major grid lines. |
| |
| | ShowMinorGridLines | Shows or hides minor grid lines. |
| |
| | ShowScrollBar | Enables an axis to display a scroll bar. |
| |
| | Split | Splits an axis creating an additional custom axis. |
| |
| | UnZoom | Sets zoom 100% on an axis. |
| |
| | ValueFromPoint | Given a point in client coordinates calculates corresponding axis value. |
| |
| | Zoom | Zooms an axis. |
| |

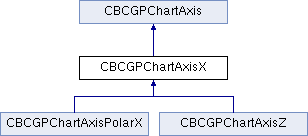
 Inheritance diagram for CBCGPChartAxisX: