 |
BCGControlBar Pro for MFC
|
|
BCGControlBar Pro for MFC
|
The CBCGPChartRangeObject class implements a Range Chart Object. A Range Object is a vertical or horizontal zone filled with a predefined color:
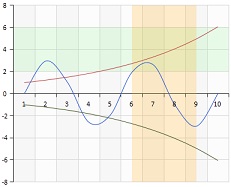
This screen shot illustrates two color ranges: horizontal (green) and vertical (orange). Use the CBCGPChartVisualObject::AddChartRangeObject helper to add a Range Chart Object to a diagram.
The following code adds two ranges as on the picture above:
 Inheritance diagram for CBCGPChartRangeObject:
Public Member Functions | ||
| CBCGPChartRangeObject | The constructor. | |
| Public Member Functions inherited from CBCGPChartObject | ||
| CBCGPChartObject | Constructs a CBCGPChartObject object. | |
| GetBoundingRect | Returns a bounding rectangle of a Chart Object. | |
| GetCoordinateMode | Returns current coordinate mode. | |
| GetCoordinates | Returns current coordinates of a Chart Object. | |
| GetDescription | Obtain a chart object's description. | |
| GetObjectSize | Call this method to retrieve custom Chart Object size. | |
| GetTooltip | Obtain a chart object's tooltip. | |
| HitTest | Hit tests an Chart Object. | |
| IsForeground | Specifies whether a Chart Object is foreground, or background. | |
| IsObjectShownOnAxis | Tells whether an object is displayed on specified axis. | |
| IsVisible | Tells whether a Chart Object is visible, or hidden. | |
| OnCalcScreenPoints | Called by the framework to calculate screen positions (in parent Chart client coordinates). | |
| OnDraw | Called by the framework when it needs to draw a Chart Object. | |
| SetAxisMarkCoordinate | Sets "axis mark" coordinate. | |
| SetCoordinateMode | Sets new coordinate mode. | |
| SetCoordinates | Sets new coordinates. | |
| SetCoordinates | Sets new coordinates. | |
| SetCoordinates | Sets new coordinates. | |
| SetForeground | Sets a Chart Object foreground or background. | |
| SetObjectSize | Sets custom object size. | |
| SetParentChart | Sets the parent Chart. | |
| SetRelatedAxes | Sets related axes. | |
| SetTooltip | Specifies a chart object's tooltip. | |
| SetVisible | Shows or hides a Chart Object. | |
Additional Inherited Members | ||
| Public Attributes inherited from CBCGPChartObject | ||
| m_format | Specifies a Chart Object formatting options. | |
| m_nObjectID | Specifies a Chart Object ID. | |
| m_strText | Specifies Chart Object's text. | |
| Protected Member Functions inherited from CBCGPChartObject | ||
| OnCalcObjectSize | Called by the framework to calculate a Chart Object size. | |
| OnDrawShape | Called to draw a Chart Object's shape. | |
| OnDrawText | Called to draw a Chart Object's text. | |