 |
BCGControlBar Pro for MFC
|
|
BCGControlBar Pro for MFC
|
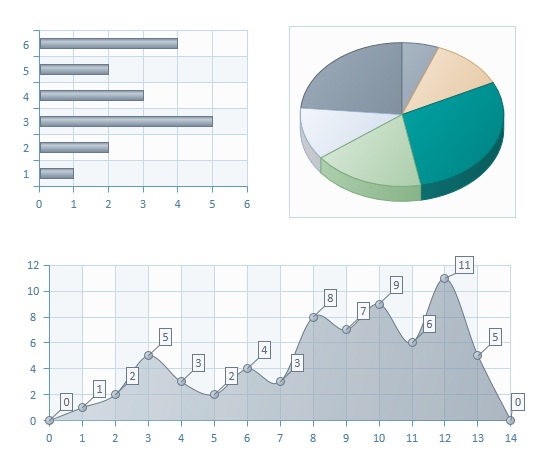
The CBCGPChartVisualObject class implements the functionality of Chart. It's derived from CBCGPBaseVisualObject and inherits all abilities of visual objects, like the ability to reside in container (so you can combine gauges and charts) and others.
The CBCGPChartVisualObject class it the key class for charting. It manages series, axes, legend and other chart elements.
The following is the list of chart elements you can manipulate and customize:
A position of a Data Point on Diagram depends on its Chart Data. The Chart Data is represented by CBCGPChartData class, which contains an array of simplest chart entities - Chart Values (CBCGPChartValue).
Each Chart Value is located within Chart Data at Component Index. Components are actually X,Y and Z values that can make up a Data Point for a specific Chart Type. Some Chart Types (like range or bubble) require more than one Y component, and they are encoded as Y1, Y2 etc.
A Data Marker is always placed at a screen position of Chart Data (this position can be customized in a derived class) and can be connected with Data Label by (callout) line.
Each Series has a built in "implementation" - a series specific class that is responsible for drawing of actual diagram shapes and does some other series specific work, like calculating data label positions on the screen. The "implementation" is represented by CBCGPBaseChartImpl class.
Take the following steps to create a Chart in an application (view-based chart).
For advanced techniques please take a look at BCGPChartExample.
The Chart and Gauges work with CBCGPGraphicsManager layer, which implements transparent D2D and GDI back ends.
The list of classes used for charting:
and Windows Control helpers:
Formatting structures:
Color theme:
Chart Layout:
 Inheritance diagram for CBCGPChartVisualObject:
Public Member Functions | ||
| CBCGPChartVisualObject | Constructs a CBCGPChartVisualObject object. | |
| AddAxis | Adds a custom axis to the internal list of axes. | |
| AddChartAxisMarkObject | Adds an axis mark Chart Object to the Chart. | |
| AddChartData | Adds data to a series. | |
| AddChartData | Adds data to a series. | |
| AddChartData | Adds data to a series. | |
| AddChartData | Adds data to a series. | |
| AddChartDataYX | Adds a new data point with specified Y and X values. | |
| AddChartDataYXY1 | Adds a new data point with specified Y, Y1 and X values. | |
| AddChartDataYXY1 | Adds a new data point with specified Y, Y1 and X values. | |
| AddChartDataYXZ | Adds new data point with Y, X and Z values - should be used for 3D charts. | |
| AddChartDataYY1 | Adds a new data point with specified Y and Y1 values. | |
| AddChartDataYY1Y2 | Adds a new data point with specified Y, Y1 and Y2 components. | |
| AddChartEffect | Adds a "Chart Effect" to a diagram. | |
| AddChartEmptyData | Adds empty data point. | |
| AddChartEmptyData | Adds empty data point. | |
| AddChartEmptyData | Adds empty data point. | |
| AddChartLineObject | Adds a new Line Chart Object to a diagram. | |
| AddChartLineObject | Adds a new Line Chart Object to a diagram. | |
| AddChartObject | Adds a new Chart Object. | |
| AddChartObject | Adds a new Chart Object. | |
| AddChartObject | Adds a new Chart Object. | |
| AddChartRangeObject | Adds a new Range Chart Object. | |
| AddChartTextObject | Adds a new Text Chart Object. | |
| AddDataPoints | Adds several data points at once. | |
| AddDataPointsOptimized | Adds array of data points. | |
| AddRelatedLegend | Associate the chart with external legend object. | |
| AddSeries | Adds a new series to the internal list of series. | |
| AdjustLayout | Adjusts chart layout. | |
| BeginPan | Called when the user begins to drag the diagram area to scroll it (in Pan mode). | |
| BindDataSQL | Bind datasource to the chart. | |
| BindDataTable | Bind datatable to the chart. | |
| CalcDataTableSize | Called to calculate data table size. | |
| CalcLegendSize | Called to calculate legend size. | |
| CalcTitleSize | Called to calculate a title size. | |
| ChartDataFromScreenPoint | Given a screen point returns a chart data. | |
| CleanUp | Removes chart data, related legends and chart objects. | |
| CleanUpChartData | Removes a specified series or all series. | |
| CreateSeries | Creates a series and adds it to the internal array of series. | |
| EnableAntialiasing | Enables or disables anti aliasing. | |
| EnableDrawLegendShape | Displays or hides legend border. | |
| EnableMagnifier | Enables magnifier mode. | |
| EnableMouseTrackingMode | Enables or disables mouse tracking mode. | |
| EnablePan | Enables pan. | |
| EnableResizeAxes | Enables to resize axes. | |
| EnableScroll | Enables or disables scrolling | |
| EnableSelection | Enables selection. | |
| EnableSmartLabels | Enables or disables "smart labels" feature. | |
| EnableZoom | Enables or disables zoom. | |
| FindChartObject | Searches for the chart object by ID. | |
| FindChartObject | Searches for the chart object by name. | |
| FindSeriesIndex | Given a pointer to a series returns series index. | |
| FireMouseMessage | Sends a mouse message to the chart's owner. | |
| FormatSeries | Formats a series with the specified index. | |
| GetAllNonFormulaSeries | Returns an array of non-formula and non-virtual series. | |
| GetAxisCount | Returns a number of axes. | |
| GetChartAreaFormat | Gets chart area format. | |
| GetChartAxis | Returns a pointer to an axis. | |
| GetChartCategory | Returns the current chart category. | |
| GetChartFillColor | Gets chart fill color. | |
| GetChartTitle | Returns chart title. | |
| GetChartType | Returns chart type. | |
| GetColors | Returns a reference to the current visual theme, | |
| GetDataLabelOptions | Gets data label options. | |
| GetDataPointFormat | Returns a pointer to a data point format. | |
| GetDataPointUserData | Returns user-defined data associated with a data point. | |
| GetDataPointValue | Returns a data point value located at the specified component index. | |
| GetDataTableArea | Returns bounding rectangle of data table area. | |
| GetDataTableFormat | Gets data table format. | |
| GetDiagram3D | Gets the chart 3D diagram. | |
| GetDiagramArea | Returns bounding rectangle of diagram area. | |
| GetDiagramFillColor | Gets diagram fill color. | |
| GetHitTooltipFlags | Returns a combination of hit info flags (BCGPChartHitInfo::HitInfoTest) telling which chart elements should have tooltips. | |
| GetLegendArea | Returns bounding rectangle of legend area. | |
| GetLegendFormat | Gets legend format. | |
| GetMouseConfig | Returns a reference to mouse configuration. | |
| GetNextCustomAxisID | Returns next available custom axis ID. | |
| GetPlotAreaFormat | Gets plot area format. | |
| GetPlotAreaPadding | Called from AdjustLayout to determine plot area padding. | |
| GetRelatedLegends | Gets external legends list. | |
| GetSeries | Returns a pointer to a series located at the specified index. | |
| GetSeriesCount | Returns the number of series. | |
| GetSmartLabelsParams | Returns current "smart label" parameters. | |
| GetTitleLabelFormat | Gets title label format. | |
| GetVisibleSeriesCount | Returns the number of visible series. | |
| HitTest | Hit tests the specified point. | |
| InvalidateTrendFormulaSeries | Invalidates trend formula series. | |
| IsChart3D | Tells whether the current chart category uses 3D engine. | |
| IsLegendHorizontal | Tells whether the legend is horizontal or vertical. | |
| IsMagnifierEnabled | Tells whether "magnifier" is enabled to zoom a diagram. | |
| IsPanEnabled | Tells whether "pan" is enabled to scroll a diagram. | |
| IsPanMode | Tells whether the chart is being scrolled using "pan", | |
| IsResizeAxesEnabled | Tells whether split axes can be resized. | |
| IsScrollEnabled | Tells whether scrolling is enabled. | |
| IsSelectionEnabled | Tells whether selection is enabled. | |
| IsShowSurfaceMapInLegend | Tells whether surface level values are included in the legend. | |
| IsSmartLabelsEnabled | Tells whether "smart labels" feature is enabled. | |
| IsThumbnailMode | Tells whether chart thumbnail mode is enabled. | |
| IsThumbTrackMode | Tells whether a chart is being scrolled using thumb track. | |
| IsZoomEnabled | Tells whether zoom is enabled. | |
| OnCalcAxisLabelSize | Called to calculate axis label size. | |
| OnCalcAxisNameSize | Called to calculate axis name size. | |
| OnCalcLegendKeySize | Called to calculate legend key size. | |
| OnCalcLegendKeySizeEx | Called by the framework to calculate a chart legend key size. | |
| OnCalcLegendLabelSize | Called to calculate legend label size. | |
| OnCreateChartSeries | Called to create a chart series. | |
| OnDraw | Called to draw the chart. | |
| OnDrawAxes | Called by the framework to draw chart axes. | |
| OnDrawAxesGridLines | Called to draw axis grid lines. | |
| OnDrawAxisLabel | Called by the framework to draw an axis label. | |
| OnDrawAxisName | Called to draw an axis name. | |
| OnDrawChartObjects | Called by the framework to draw chart objects. | |
| OnDrawDiagram | Called to draw a diagram area. | |
| OnDrawDiagramDataLabels | Called by the framework to draw chart diagram data labels. | |
| OnDrawDiagramErrorBars | Called by the framework to draw chart error bars. | |
| OnDrawDiagramMarkers | Called by the framework to draw chart diagram markers. | |
| OnDrawSelection | Called by the framework to draw a chart selection. | |
| OnDrawTickMark | Called by the framework to draw a chart tick mark. | |
| OnFormatDataPointLabelText | Called by the framework to obtain a data point text label. | |
| OnFormatDataPointTableText | Called by the framework to obtain a data point table label. | |
| OnFormatDataPointTooltip | Called by framework to obtain a data point tooltip. | |
| OnFormatDataPointTooltipDescription | Called by framework to obtain a chart tooltip description. | |
| OnGetAxisNameAreaRect | Called to retrieve a bounding rectangle of axis name. | |
| OnGetWallThickness | Returns wall thickness for 3D charts. | |
| OnSetMouseCursor | Called to set the mouse cursor. | |
| RecalcMinMaxValues | Recalculates minimum and maximum values for all series. | |
| RemoveAllChartEffects | Removes all chart effects. | |
| RemoveAllChartObjects | Removes all Chart Objects. | |
| RemoveChartObject | Removes a chart object from the diagram. | |
| RemoveCustomAxis | Removes a custom axis for the chart. | |
| RemoveRelatedLegend | Removes the related legend from the chart. | |
| ReplaceDefaultAxis | Replaces a default axis with a custom axis. | |
| ResetAxes | Resets all axes to default state. | |
| ScreenPointFromChartData | Given a chart data returns a screen point in chart's owner client coordinates. | |
| ScrollAxis | Scrolls an axis by specified number of units (in axis units). | |
| SetAutoDisplayRange | Sets automatic display range. | |
| SetAxisName | Sets axis name. | |
| SetChartData | Sets a data point value at the specified component index. | |
| SetChartFillColor | Sets chart fill color. | |
| SetChartTitle | Sets the Chart title. | |
| SetChartType | Sets Chart category and type. | |
| SetColors | Sets visual theme. | |
| SetColors | Sets visual theme. | |
| SetCurveType | Sets curve type. | |
| SetDataLabelsOptions | Sets common data label options. | |
| SetDataPointCategoryName | Assigns a category name to a data point. | |
| SetDataPointDataLabelText | Sets custom data label text for specified data point. | |
| SetDataPointFormat | Applies a custom style (format) to a data point. | |
| SetDataPointLegendLabelText | Sets custom legend label text for the specified data point. | |
| SetDiagramFillColor | Sets diagram fill color. | |
| SetFixedDisplayRange | Sets fixed display range. | |
| SetHitTooltipFlags | Specify chart elements where tooltip need to be displayed. | |
| SetLegendPosition | Sets legend position or hides it. | |
| SetOptimizedDiagramArea | Specifies whether diagram's layout should be optimized after one of axes moves inside/outside the diagram's area. | |
| SetPlotAreaPadding | Sets plot area padding. | |
| SetSelectionType | Sets selection type. | |
| SetSeriesName | Sets a series name. | |
| SetSeriesShadow | Enables or disables the series shadow. | |
| SetSmartLabelsParams | Call this method to set "smart label" parameters. | |
| SetTernaryAxesLabelMode | Sets new label mode for all ternary axes. | |
| SetTernaryAxesTitleMode | Sets new title mode for all ternary axes. | |
| SetThemeOpacity | Sets opacity of current color theme. | |
| SetThumbnailMode | Enables/disables chart thumbnail mode | |
| SetZoomScrollConfig | Sets zoom/scroll configuration. | |
| ShowAllDataLabels | Shows or hides data labels on all data points. | |
| ShowAxis | Shows or hides an axis. | |
| ShowAxisGridLines | Shows or hides major and minor grid lines for the specified axis. | |
| ShowAxisIntervalInterlacing | Enables or disables major axis interval interlacing. | |
| ShowAxisName | Shows or hides an axis name. | |
| ShowChartTitle | Shows or hides the chart title. | |
| ShowDataLabels | Shows or hides data labels for all series. | |
| ShowDataMarkers | Shows or hides data markers for all series. | |
| ShowDataTable | Shows or hides the chart data table. | |
| ShowScrollBar | Shows or hides a scroll bar for the specified axis. | |
| ShowScrollBars | Shows or hides scroll bars for all axes. | |
| ShowSeries | Shows or hides a series. | |
| StartAnimation | Show the chart series with animation effect. | |
| SwapAxesDirections | Rotates all axes on 90 degrees. | |
| UnZoom | Unzooms a diagram. | |
| Zoom | Zooms the chart in or out. | |
| Public Member Functions inherited from CBCGPBaseVisualObject | ||
| CBCGPBaseVisualObject | Constructor. | |
| CBCGPBaseVisualObject | Copy constructor. | |
| CopyToClipboard | Copies visual object to the Clipboard. | |
| EnableImageCache | Enables or disables visual object image cache. | |
| EnableTranslation | Enables the translation of the hosted visual objects. | |
| ExportToBitmap | Exports the visual object to bitmap. | |
| ExportToFile | Exports the visual object to a file (BMP or PNG). | |
| ExportToImage | Exports the visual object to an image. | |
| GetData | Gets an internal data object. | |
| GetDataAnimationType | Gets data animation type. | |
| GetDataCount | Returns a number of data objects. | |
| GetEditFlags | Gets editing flags. | |
| GetID | Gets the object identifier. | |
| GetName | Gets the object name. | |
| GetParentContainer | Gets the parent visual container. | |
| GetRect | Gets the object bounding rectangle. | |
| GetSelectedTheme | Obtain a currently selected visual theme. | |
| GetUserData | Gets user-defined data associated with this object. | |
| GetValue | Gets the object value. | |
| GetVisualEffect | Retrieves a visual effect | |
| IsAutoDestroy | Tells whether this object will be destroyed automatically. | |
| IsEditMode | Tells whether this object has the edit mode. | |
| IsEnabled | Tells whether the visual object is enabled. | |
| IsImageCache | Tells whether image cache is enabled for this object. | |
| IsSelected | Tells whether this object is selected in the parent container. | |
| IsTranslation | Tells whether the hosted visual objects should be translated. | |
| IsVisible | Tells whether the visual object is visible. | |
| Redraw | Redraws this object. | |
| RedrawRect | Redraws a specified rectangle. | |
| SetAutoDestroy | Specifies whether the object should be destroyed automatically. | |
| SetDataAnimationType | Sets data animation type. | |
| SetDirty | Invalidates and redraws a visual object. | |
| SetEditFlags | Sets editing flags. | |
| SetFillBrush | Sets a new fill brush. | |
| SetID | Sets the object identifier. | |
| SetName | Sets an object name. | |
| SetRect | Sets a new bounding rectangle. | |
| SetSelected | Selects or unselects the object in the parent container. | |
| SetUserData | Sets user-defined data associated with this object. | |
| SetValue | Sets the object value. | |
| SetVisible | Shows or hides the visual object. | |
| SetVisualEffect | Sets a visual effect. | |
Public Attributes | ||
| m_chartLayout | Can be used to directly modify chart layout. | |
Protected Member Functions | ||
| DoMouseRotate | Called by the framework when user rotates the chart. | |
| OnAddSeries | Called when a new series is being added to the internal array of series. | |